A Pair of Infographic Eye Candies

Biographic Austen by Sophie Collins
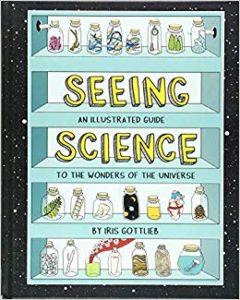
Seeing Science: An Illustrated Guide to the Wonders of the Universe by Iris Gottlieb
Summer’s heat and humidity have cooked my brain, and no matter how much I’d like to lounge around immersed in a giant, juicy, beach read I find myself unable to keep one going. Picture books to the rescue! Adults need picture books, too, no matter their intended audience. Picture books for grown-ups are nothing new and are easy to find–titles about decorating, photography, travel, etc., in non-fiction plus loads of graphic novels and comics.
Book-length infographics are the new kids on the block. Like their stand-alone relatives, they primarily use images (charts, graphs, illustrations) to relay information and provide a digestible view of a complex topic. The images are often colorful and can be hand-drawn or computer-generated. Accompanying text can range from very light to paragraph-length captions. The visual presentation is as artistic as it is informative.
Biographic Austen by Sophie Collins is a great example of this new-ish genre. It displays Jane Austen’s life and literary career in engaging, sometimes whimsical, pictures; it also places her in context with political, economic, social, and literary events of her day. Collins skillfully uses contemporary typeface and design elements to pull back the curtain on Regency-era life. In “Who Drives What?”, she outlines horse-drawn transportation used by various Austen characters by brief definition and a comparison to automobiles. (No surprise that Sense and Sensibility’s Mr. Willoughby drove a single-seat curricle, “Like a Porsche!”). “Plots of Persuasion” is a jaunty flow chart in muted pinks and greens that follows the final chapters of Persuasion’s final version and first draft (now in the British Library) point by point. “Austen’s Laptop” shows writing tools she would have used–lap desk, quill pen, paper–including a recipe for homemade ink.
Give this visual biography of Jane Austen to a Janeite of your acquaintance or to someone just introduced to her novels; this is a book for older teens and adults or for younger teens who absolutely love the topic. Biographic Austen is part of the “Great Lives in Graphic Form” series of Ammonite Press–several of which the library owns (including Biographic Bowie, a must for David Bowie fans).
Iris Gottlieb puts a hand-drawn, text-laden twist on the infographic in her book, Seeing Science: An Illustrated Guide to the Wonders of the Universe. A citizen scientist, Gottlieb created her book “to open up the world of complex science with art and metaphor and storytelling”. She divides her work into sections focusing on life science, earth science, and physical science. Each section offers a variety of topics presented in two-page spreads. She serves whimsy at every turn from subject choice to section titles to illustrations. Her text is clear, concise, and solid.
In “How Food Is Preserved: Eight Ways to Eat Fish Later”, she straightforwardly presents the hows and whys of chemistry’s role in food preservation while she jazzes up the entry with colorful, amusing depictions of preserved fish. I can’t believe I just wrote that sentence, but her drawings of a fish head in a Hoover (vacuum-sealed) and a fish lollipop (sugar-cured) are a hoot! Gottlieb’s dry wit winds its way through the book as in “Vacuums: Creating Nothingness, Then Filling It With Dog Hair”, “Glaciation: As Explained By A Snickers”, and “Ferns: Introverts of the Forest Floor”. (Yes, it sounds odd. No, this is not a spoof. Read the book and see for yourself.) My favorite entry is “Measuring pH: In A Cabinet of Gross Liquids”. A drawing of shelves holding jars of different liquids sits on the right-hand page. The left-hand page holds the key to the mystery of the jars. Gottlieb defines pH and explains how the pH scale is structured. Along the top is a rainbow-colored pH scale. A box down the side of the page lists the contents of each jar in the previously-mentioned drawing with the contents color-coded according to the pH scale, so water appears in the bright green assigned to neutral pH while battery acid is written in the bright red reserved for the most acidic substances and drain cleaner shows the deep purple of the most basic end of the scale. She’s included illustrated definitions of the word “mole” at the end of the entry, thereby clearing up the perennial confusion around this chemistry term.
Seeing Science is loads of sassy, scientific fun. It’s a great way to dip into science basics or to clarify scientific principles muddied by confusing textbooks. High schoolers and adults are a great audience for this book; it’s also suitable for middle school science fans who have had “the talk” about reproduction. The author writes, “It is my hope that this book makes science more accessible, less intimidating, and more magical to anyone who has a sense of wonder–and a sense of humor.” She certainly hits the mark!


